
- Print |
We calculate our water footprint to improve
the quality of our infrastructures and water supply
In our goal of achieving efficient water management and identifying concrete actions to improve public service, we have calculated our water footprint and our water footprint to assess the use and impact associated with the consumption and degradation of water in our infrastructures.
In line with our commitment to the circular economy and sustainability, we have gone further by evaluating our water footprint using the two most widespread methodologies: the one proposed by the Water Footprint Network (WFN) and the one defined in ISO 14046.
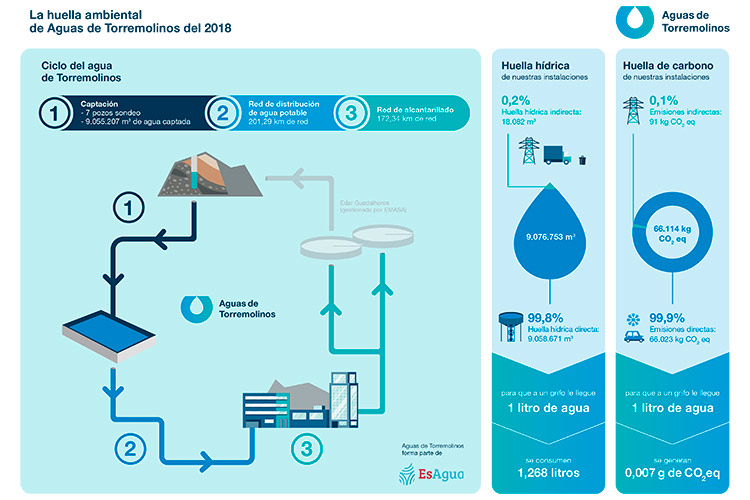
On the one hand, the evaluation of the water footprint according to the WFN approach allows us to measure and value the use that we give to water directly and indirectly through three components (blue, related to fresh water consumption; green, related with rainwater; and gray, related to water degradation). On the other hand, the calculation of the water footprint according to ISO 14046 allows us to analyze the impacts that the use of water has on the environment. In other words, assigned models are used to accurately measure the impact of water on the environment.
In this case, we have analyzed all our infrastructures associated with the urban water cycle: seven catchment wells, the infrastructures of the transport and distribution networks of drinking water (201km), the networks of sewage collectors (172km), and the offices. The project has been developed taking into account business activities related to the integral water cycle; and we have calculated the impacts associated with the facilities over which we have control during 2018.
Efforts will be aimed at minimizing losses in transport
As a result of the water footprint, we have obtained that 99.8% of total water consumption is of direct origin; that is to say, it comes directly from the fresh water inflows and outflows from groundwater; and only 0.2% is indirect and is mainly associated with the electricity consumption of the catchment.
Therefore, within this stage, efforts to reduce the footprint will be focused on minimizing losses in the transmission and distribution network (in the year of study, Unregistered Water was equivalent to 21% of distributed water).
Considering the losses in the network, the footprint of the catchment and the footprint of the supply network, it is estimated that consuming 1L of water from the Torremolinos network represents 1,268L of water footprint. This means that for a citizen to get 1L of water to their tap, 1,268L have been consumed in the process.
Although the weight of the footprint associated with the supply chain has turned out to be low in relation to the water footprint associated with the catchment, the importance of its quantification for efficient water management in the different stages of the integral cycle has been demonstrated.
The study has also allowed us to verify that the footprint associated with the construction phase of the supply and distribution networks is relevant to the total indirect footprint of the urban cycle. This footprint, which refers to the water consumed to build these networks, represents 32% of our indirect water footprint.
So, although the results are favorable, our efforts will be directed mainly to reducing our environmental impact by minimizing the losses that occur in the network to improve the efficiency of supply.
This analysis has been carried out by Cetaqua, the Water Technology Center. Cetaqua has a public-private collaboration model, which was created to guarantee the sustainability and efficiency of the water cycle, considering territorial needs. This has established itself as a reference in the application of academic knowledge to water and the environment, creating products and services that benefit society.